Code Graph.
See how your code connects.
Turn a project folder into an interactive map of files, functions, components, routes, SQL tables and Docker services, and the calls and imports between them.
Version 1.0.0 · Windows · Portable version available
YOUR CODE NEVER LEAVES YOUR DEVICE
Understand a codebase at a glance
Explore how files, functions and services connect without sending your code anywhere.
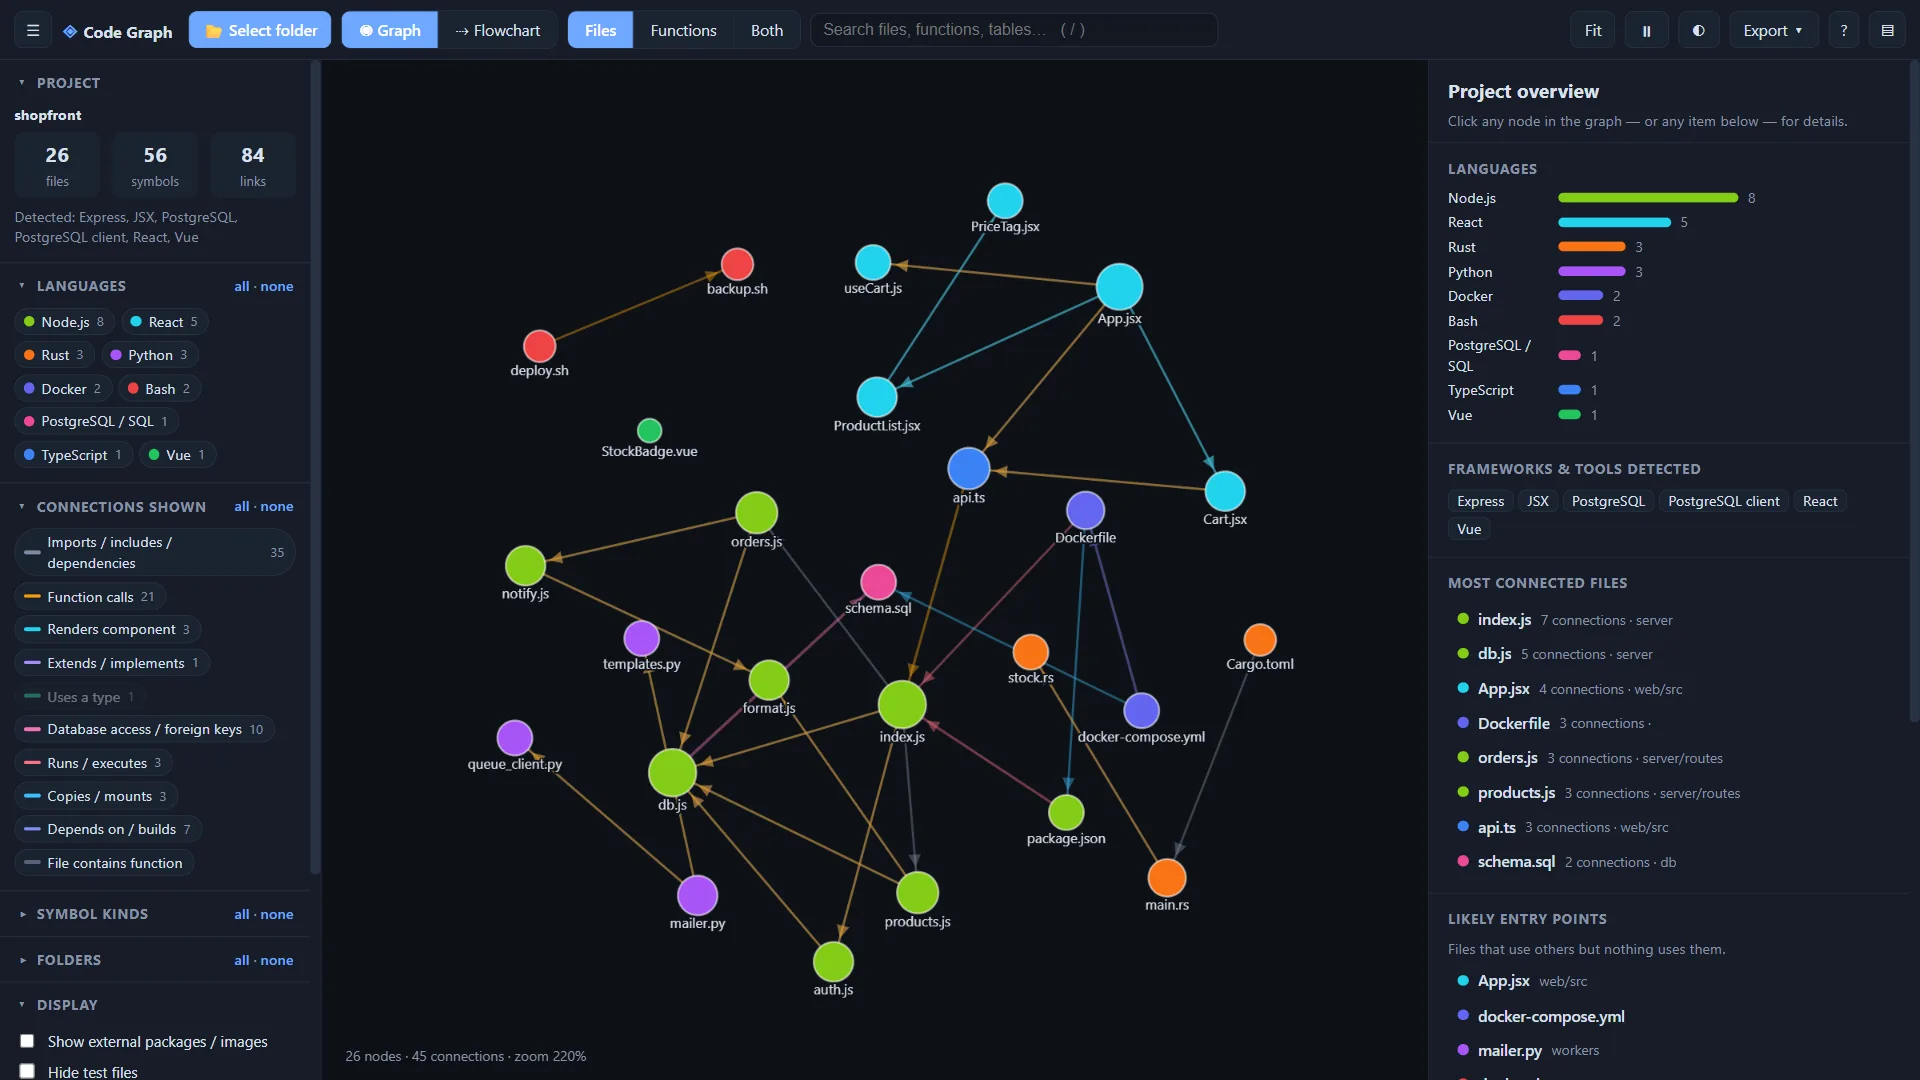
Two views
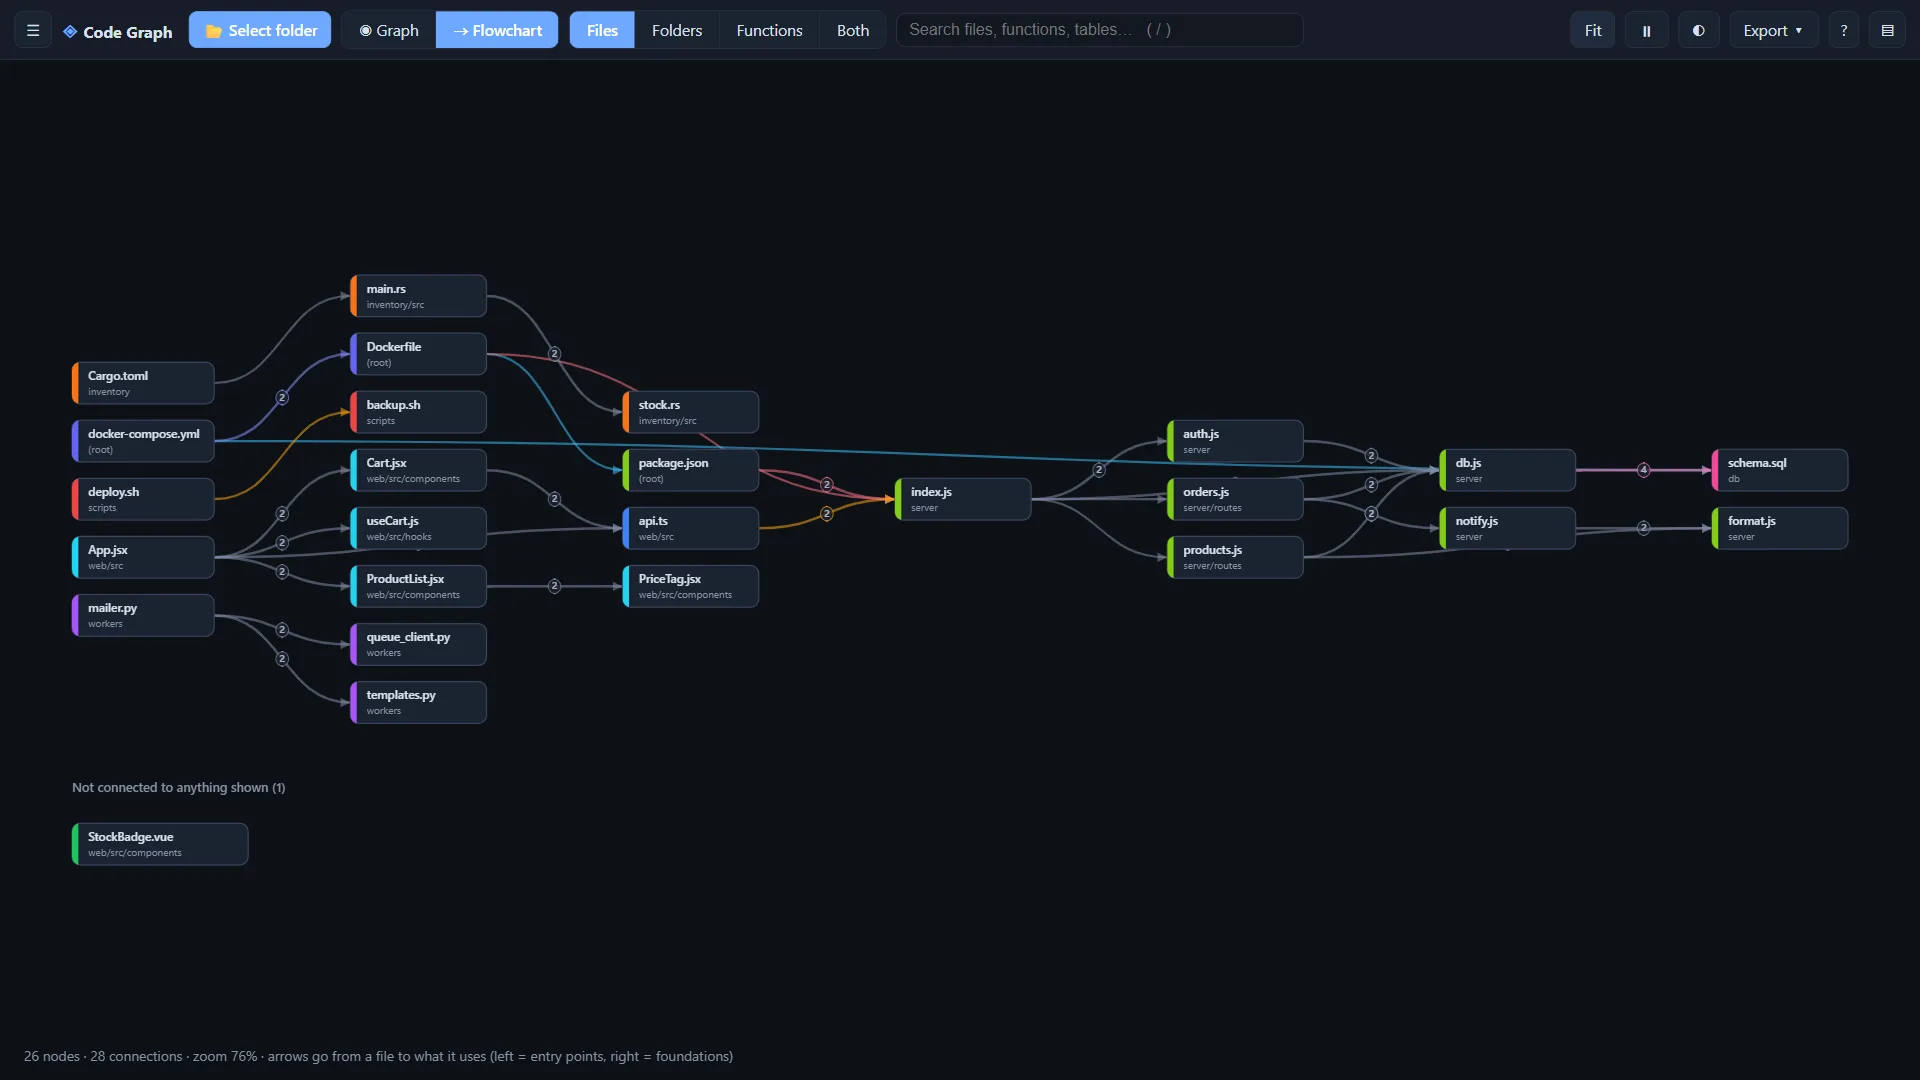
Switch between a force-directed graph and a flowchart with entry points on the left and their dependencies to the right.
Adjustable detail and filters
Show files, folders, functions or a mix. Narrow the graph by language, connection type, symbol kind and folder.
Instant search
Press / to quickly find files, functions and tables anywhere in your project.
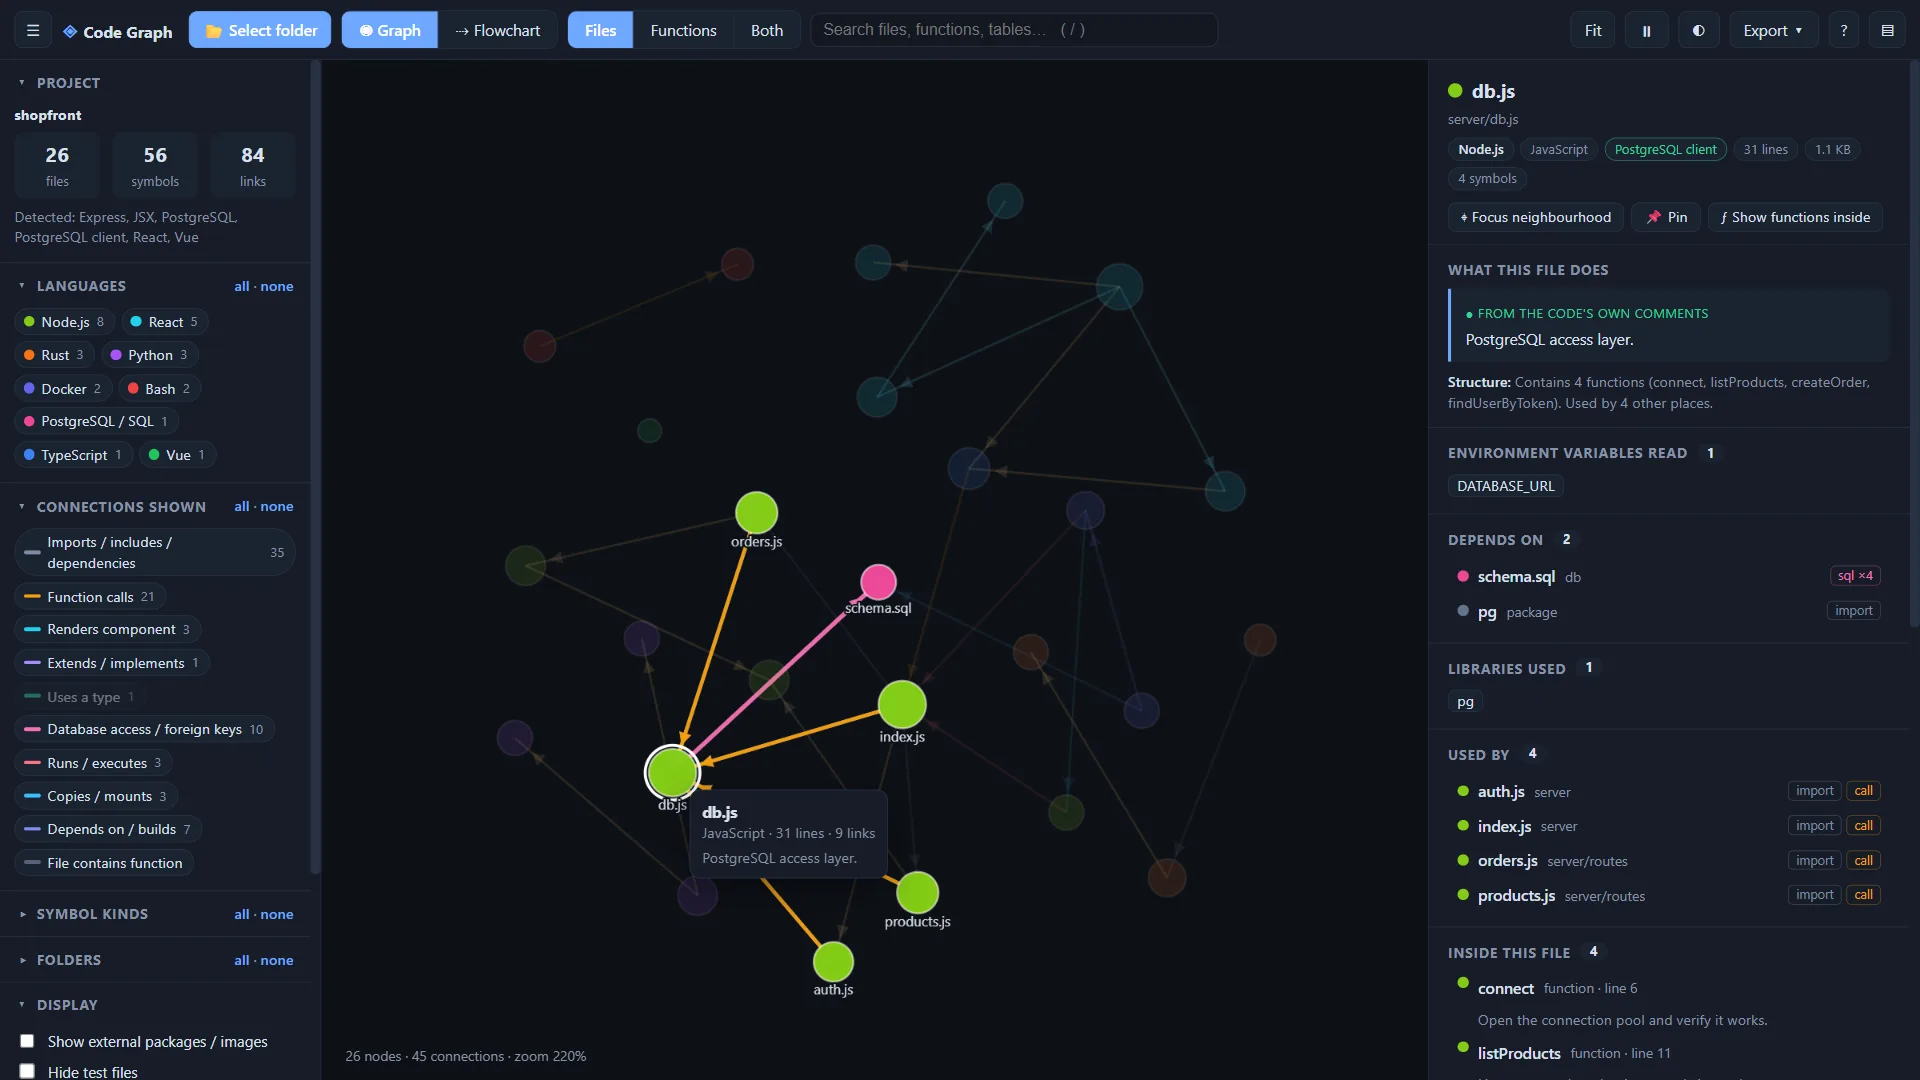
Details panel
Select a node to see its description, signature and relationships. Descriptions inferred from names and structure are marked as inferred.
Export anywhere
Save the graph as a self-contained interactive HTML snapshot, a JSON file or a PNG image.
Private and offline
Everything runs locally in your browser. Your code is never uploaded and no internet connection is required.
Watch Code Graph in under 3 minutes
A quick walkthrough of loading a project, exploring the graph and exporting a snapshot.
YouTube Video
Two ways to see your project
Switch between a force-directed graph and a flowchart with entry points on the left and their dependencies to the right.
Click any node to understand it
Select a node to see its description, signature and relationships. Double-click to focus on its neighbourhood, or drag it to pin it in place.
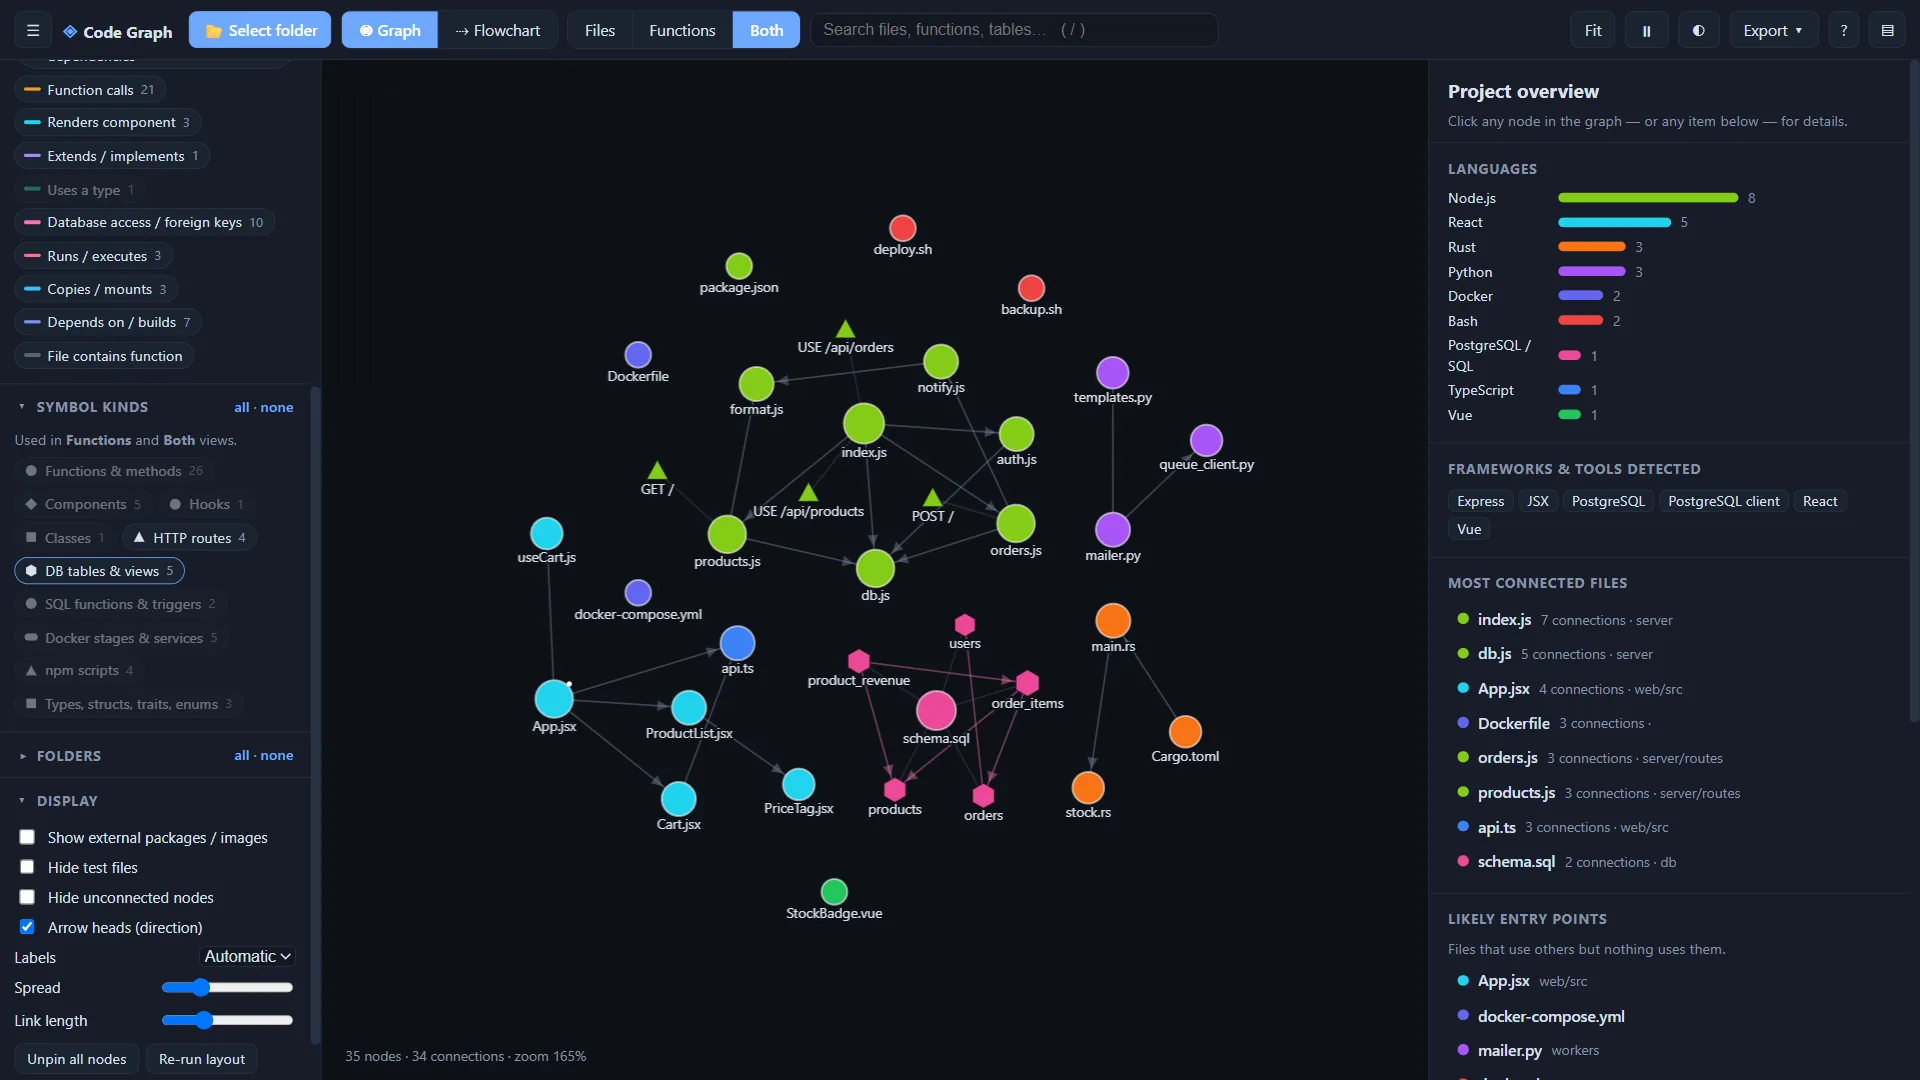
Routes, tables and services are nodes too
Switch to Functions or Both to see HTTP routes, database tables, hooks, components and Docker stages alongside your files, and the connections between them.
Find it, share it, read it anywhere
Search across everything, export a snapshot and switch themes when you need to.
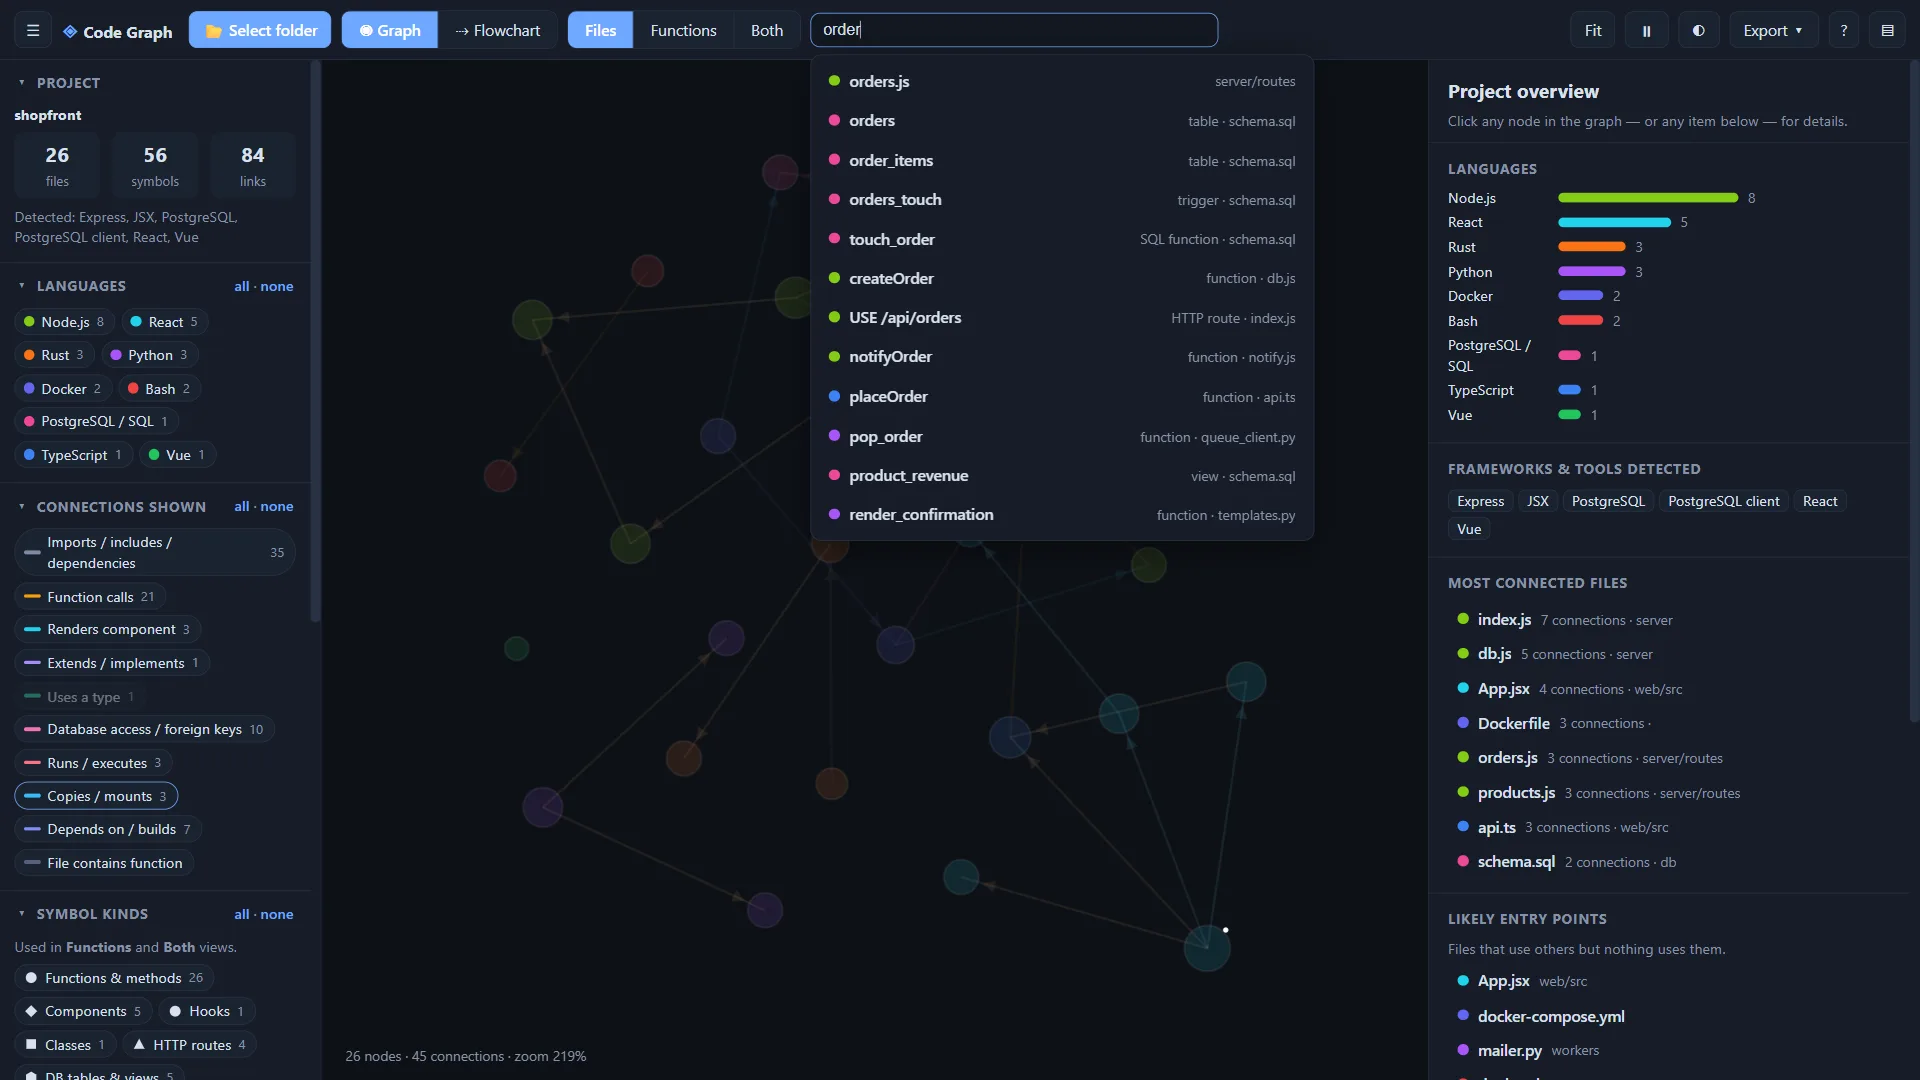
Instant search
Press / to find files, functions, routes and tables, then jump straight to the result.
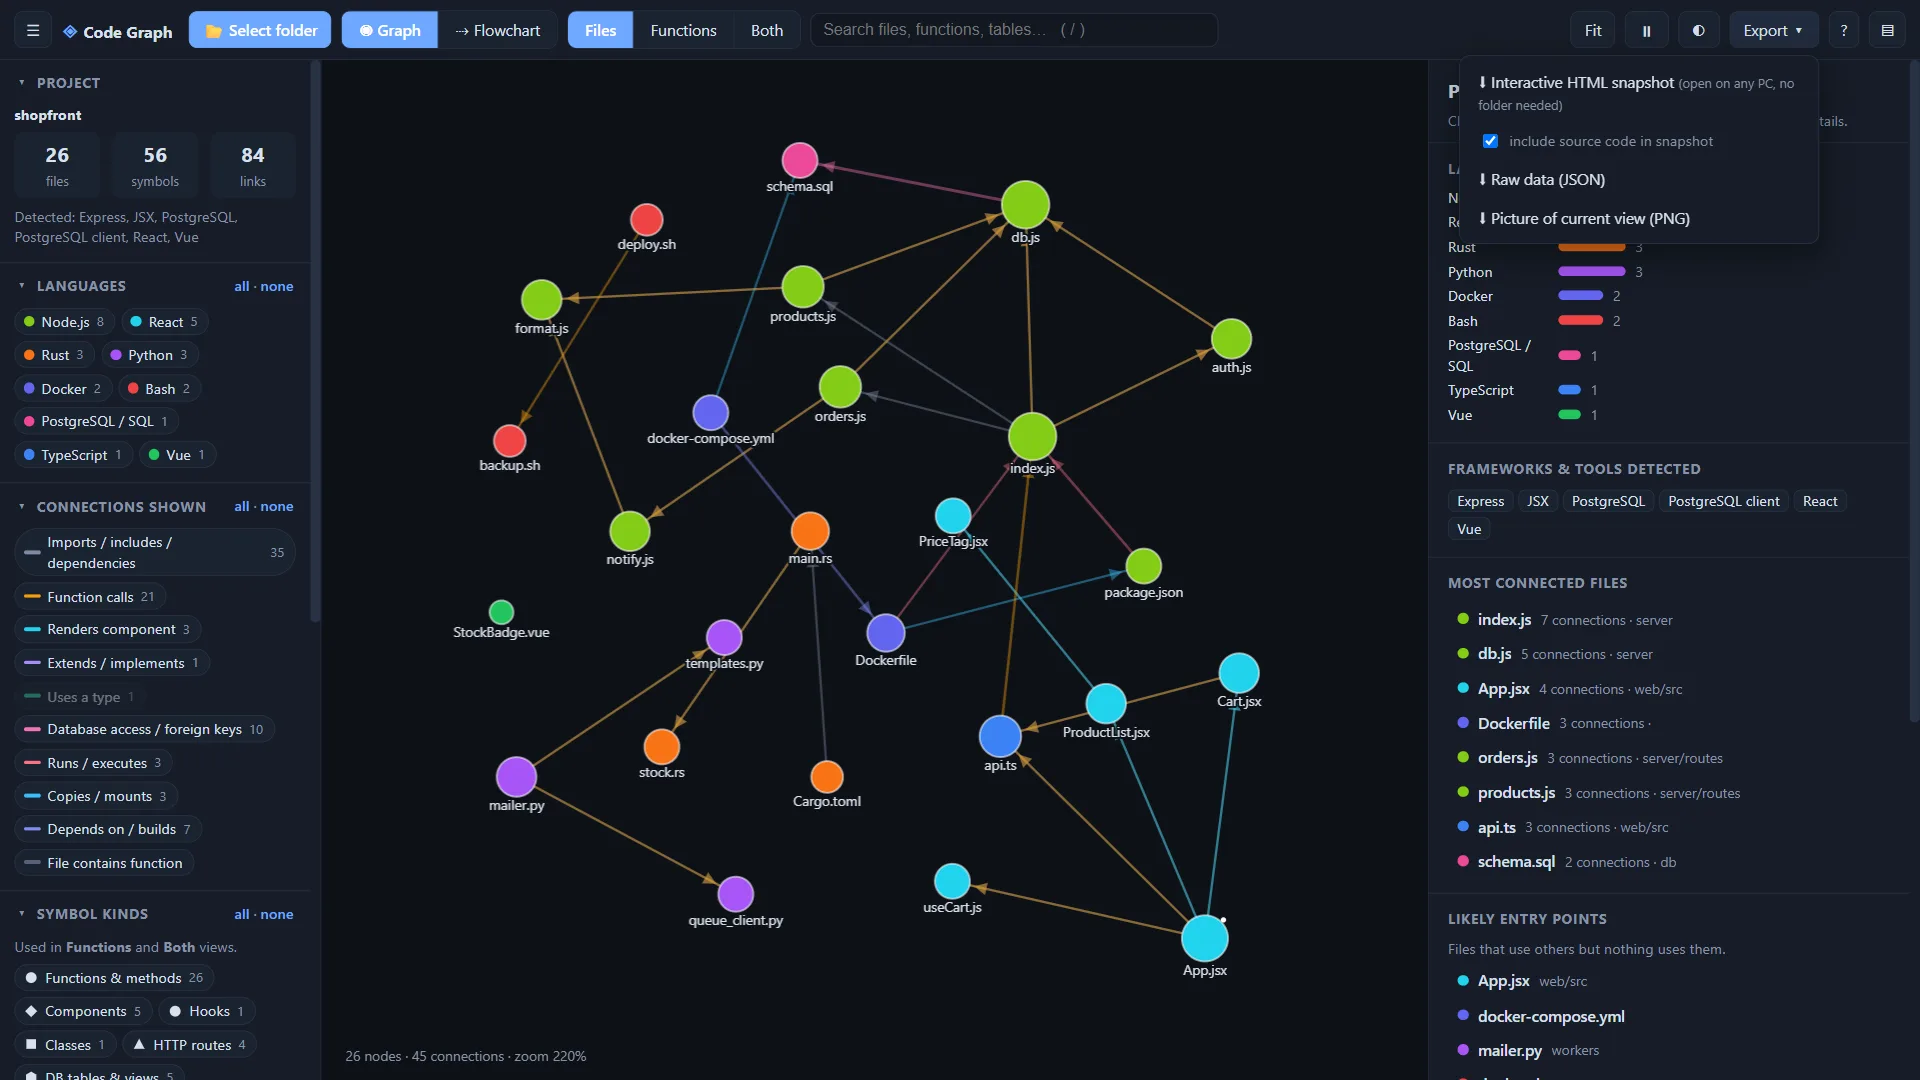
Export a snapshot
Save an interactive HTML file anyone can open, the raw JSON data or a PNG of the current view.
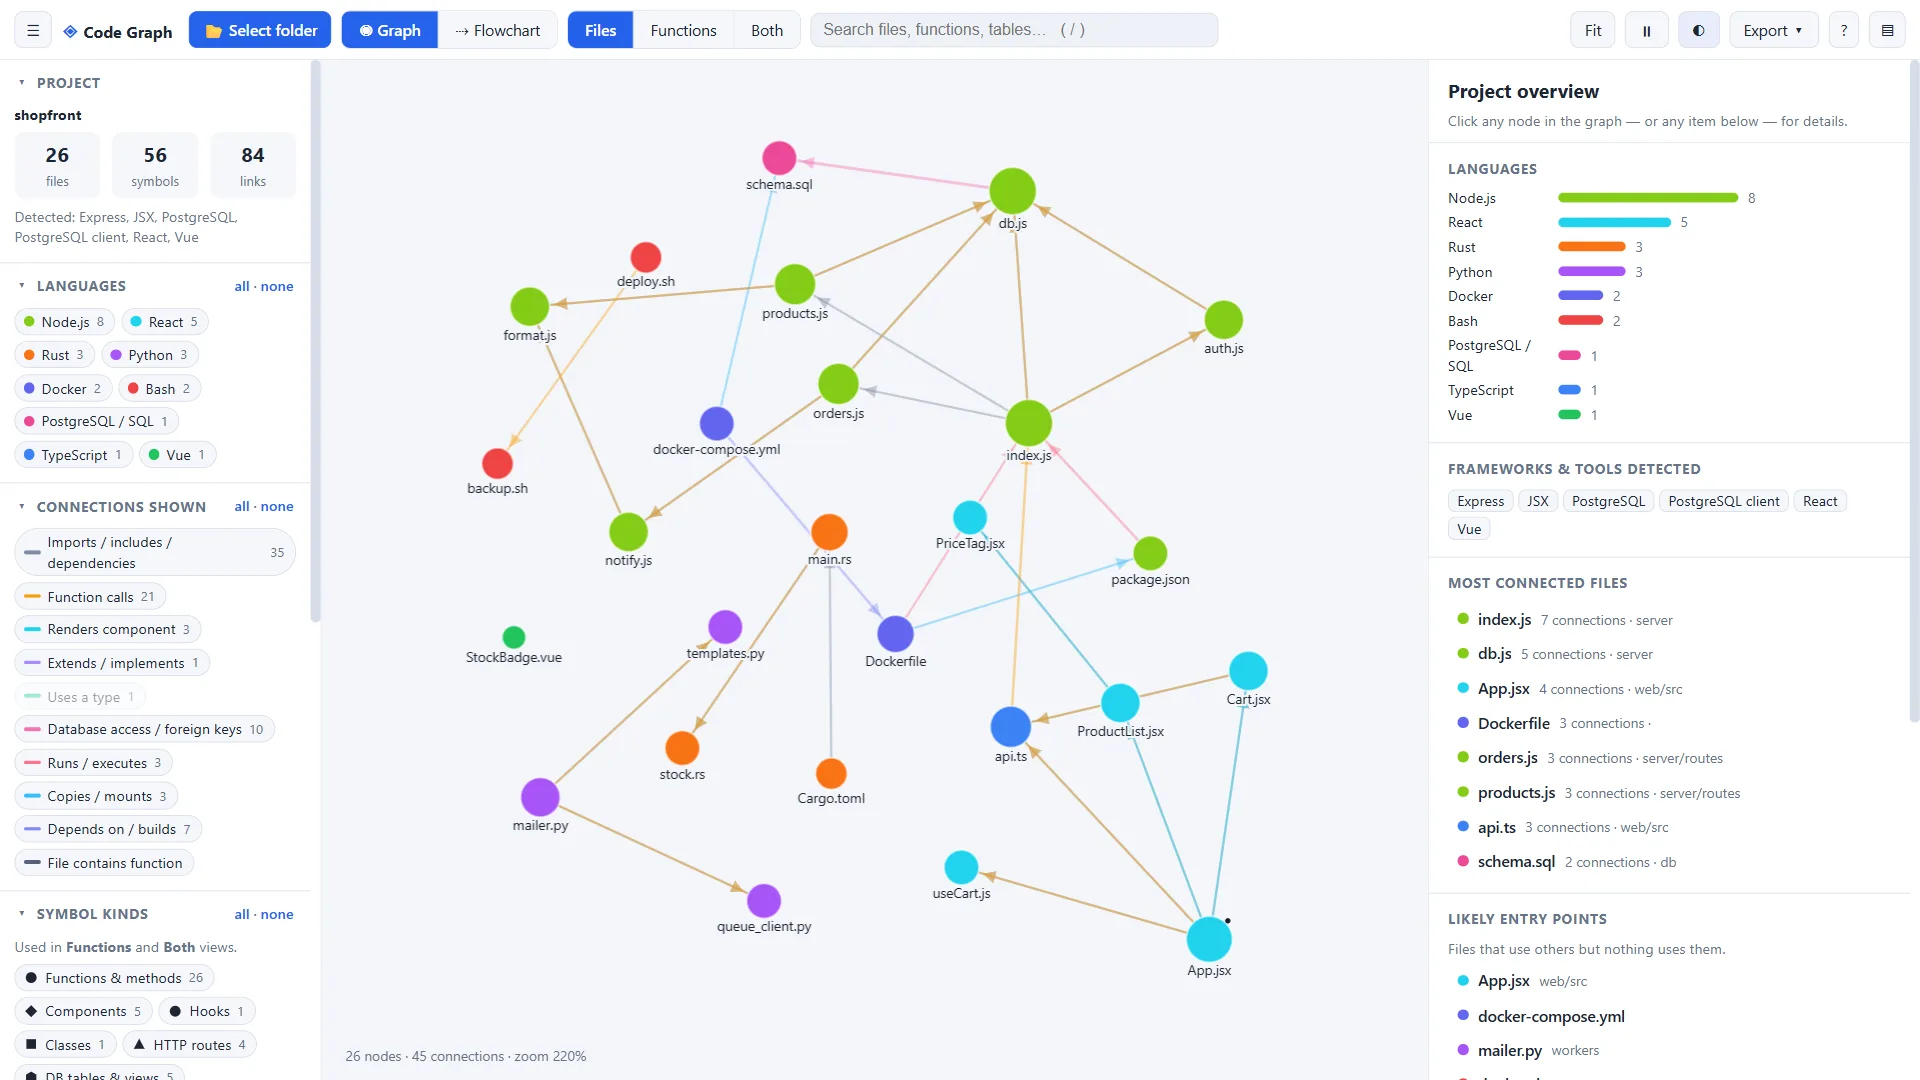
Light and dark themes
Switch to a light theme for documents and presentations.
Get Code Graph for your system
Version 1.0.0. Portable builds run without installing anything. Open the file and select a project folder.
Windows
Windows 10 or later
Linux
Ubuntu 20.04+, Fedora, Debian · 64-bit
Coming soon
macOS
macOS 11 or later · Apple Silicon & Intel
Coming soon
Looking for older versions or checksums? See all releases on GitHub
Built in the open.
The complete source code is on GitHub. Read it, build it, report bugs or send a pull request.
Common questions
Yes. It is free and open source under the MIT licence, with no ads, no accounts and no paid tier.
No. Everything runs locally in the browser. Your code is never uploaded and no internet connection is required.
No. CodeGraph.exe is a portable launcher that embeds the app and opens it in its own window, with no installation or administrator rights needed. You can also open the single code-graph.html file in a Chromium-based browser such as Edge or Chrome.
JavaScript, TypeScript, React, Vue 3, Node.js, Python, Rust, PostgreSQL and SQL, Docker (Dockerfile and Compose) and Bash.
From comments and docstrings where present. Otherwise they are inferred from names and structure and marked as inferred.
Press / to search, F to fit the graph to the screen, P to pin or unpin the selected node, and Esc to clear the selection. Click a node for details, double-click to focus on its neighbourhood, and drag to move and pin it.
Yes. Export a self-contained interactive HTML snapshot, a JSON file or a PNG image.
Absolutely. The full source is on GitHub. Issues, feature requests and pull requests are welcome.